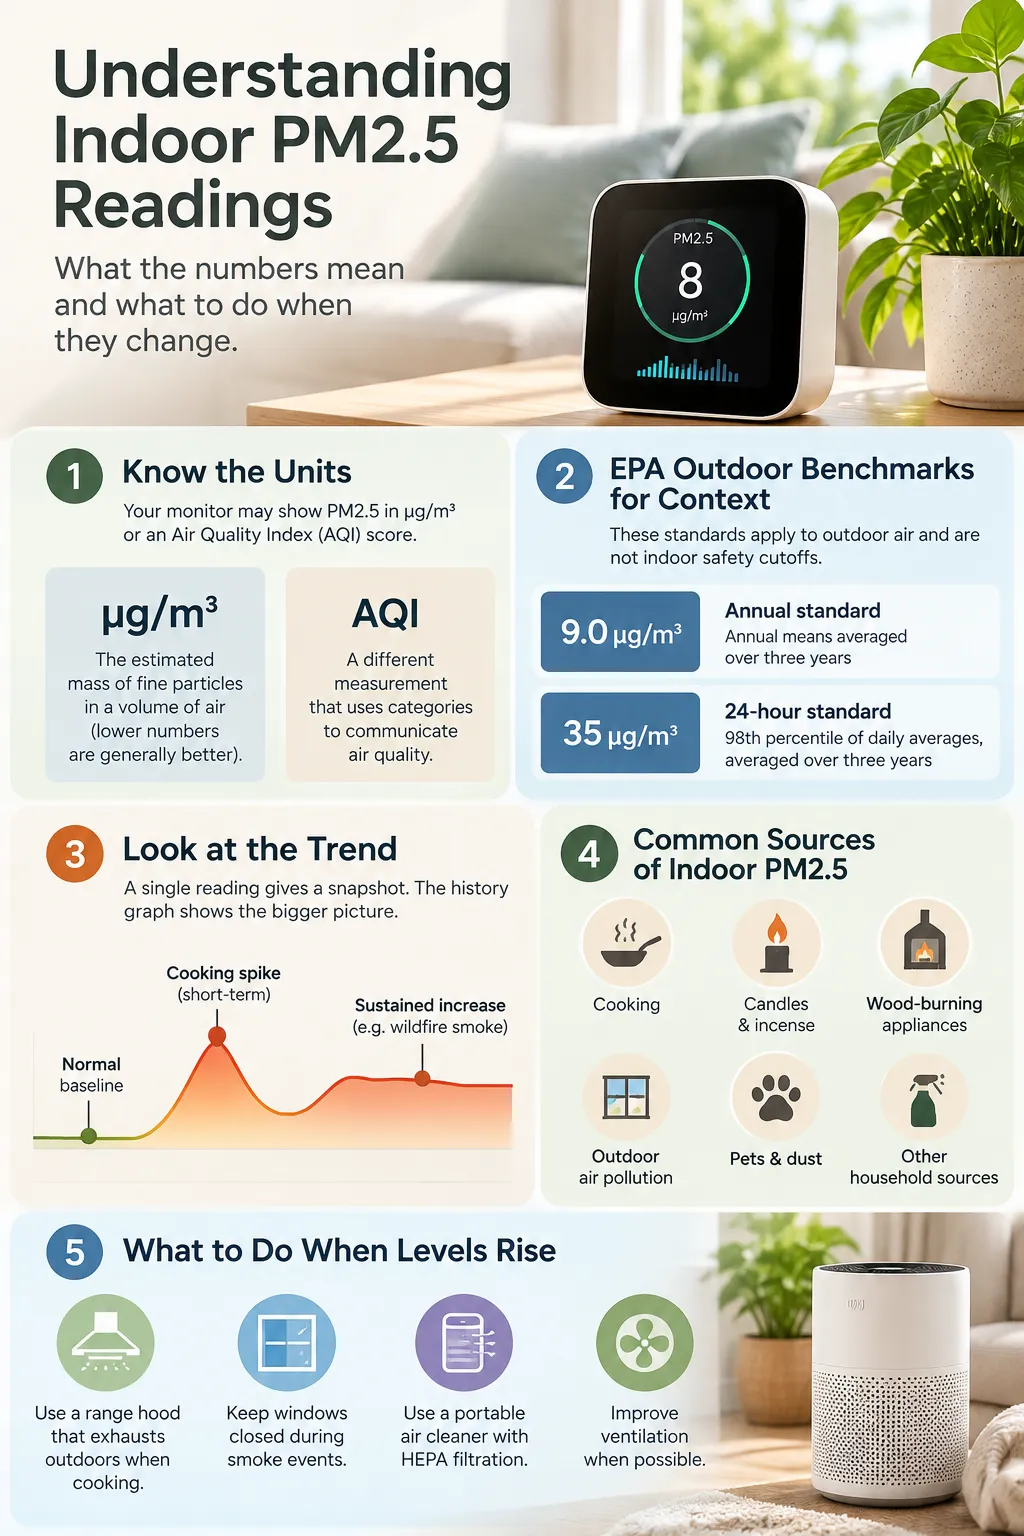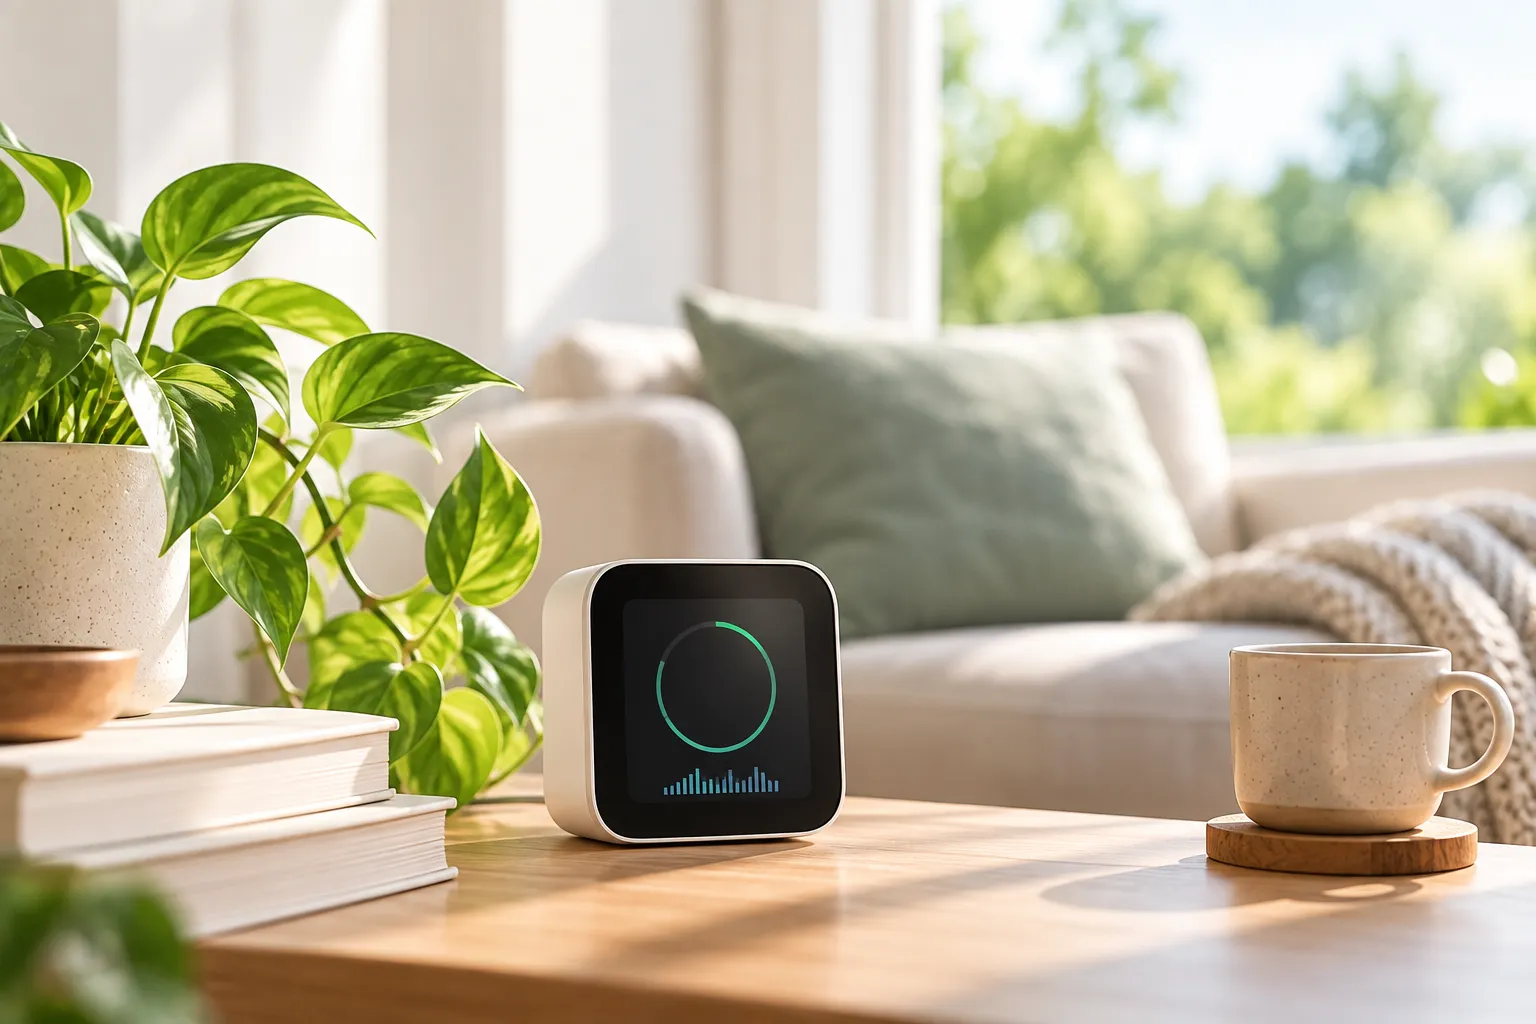
To understand indoor air quality, check three things on your monitor: the units, the trend, and what changed nearby. PM2.5 levels usually estimate fine-particle concentration, and lower sustained readings are generally preferable.
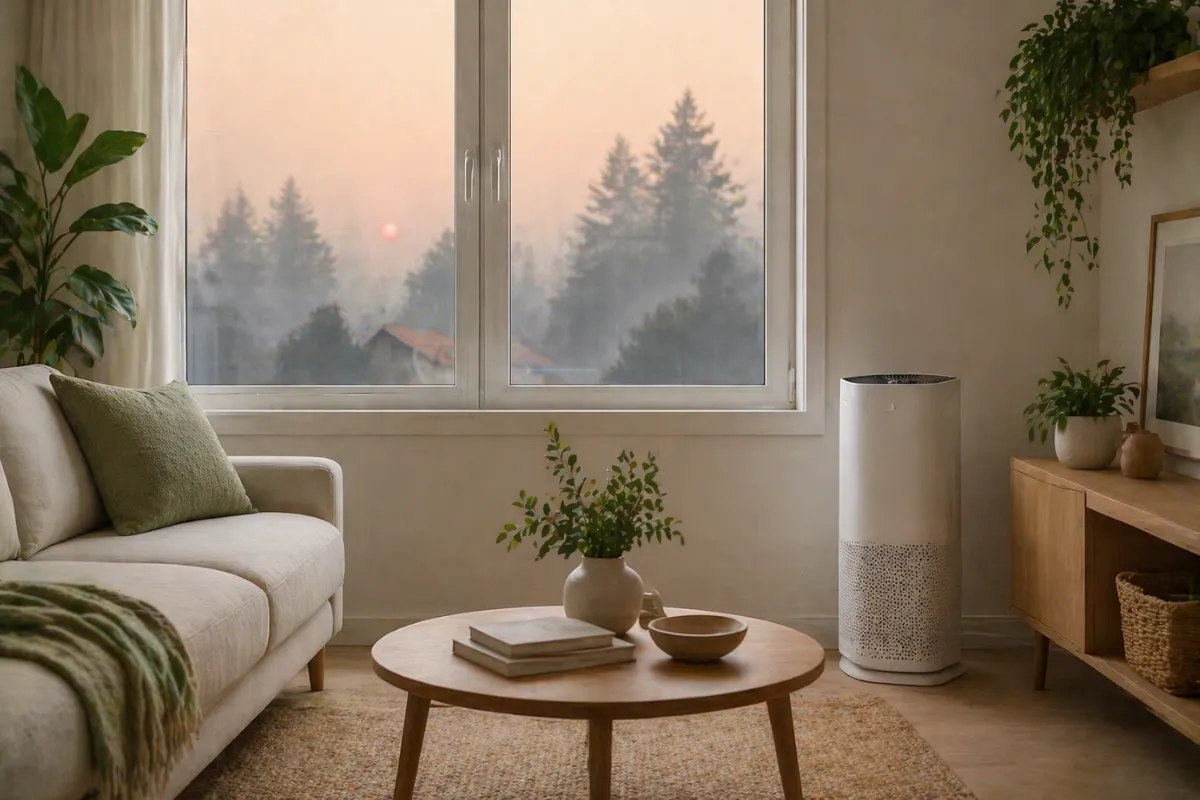
A cooking spike deserves a different response from readings that stay elevated throughout the evening, perhaps when wildfire smoke affects indoor readings. Start by understanding the display, then use it to guide practical changes without treating every fluctuation as a health warning.
Key takeaways
- Check whether the screen shows PM2.5 concentration in µg/m³ or an Air Quality Index (AQI) score.
- Compare readings over time, especially before and after cooking, a change in airflow, or filtration.
- Treat EPA outdoor standards as context, not indoor safety cutoffs or medical advice.
You don’t need to watch the display constantly. A consistent monitoring routine makes the information more useful and less distracting.
Read PM2.5 levels in the right units
PM2.5 particles are 2.5 micrometers in diameter or smaller, too small to judge reliably by looking around the room.
Most consumer monitors estimate their concentration using optical sensors. Light scatters off particles, and the device converts that signal into an estimated mass concentration.
What µg/m³ tells you
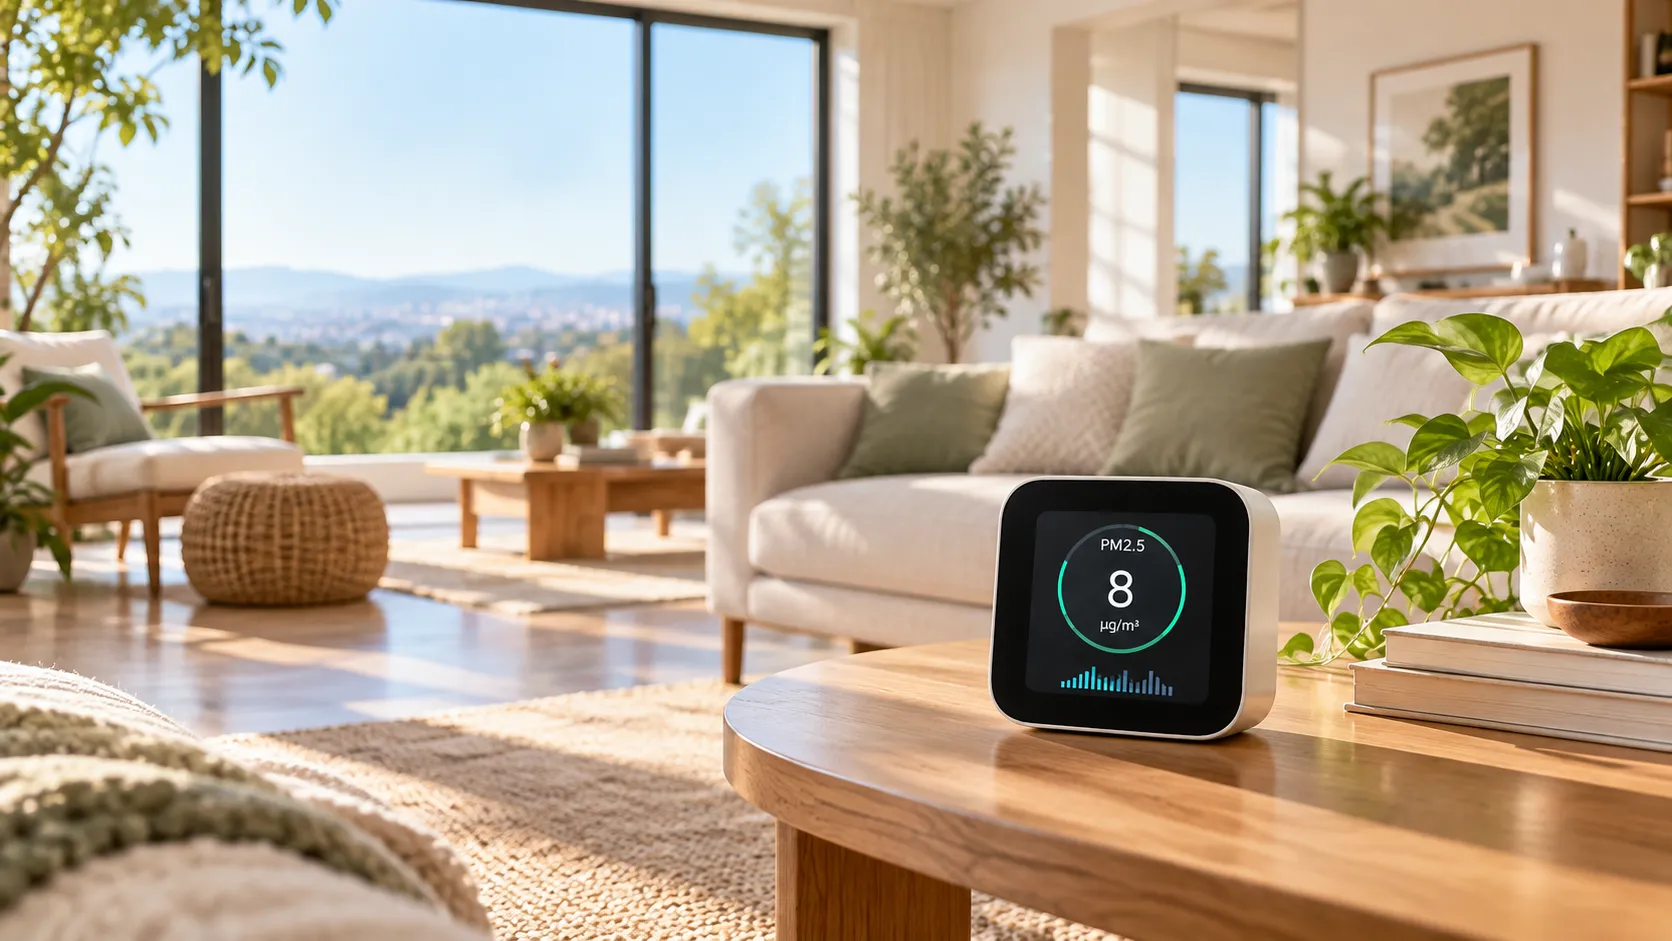
The unit µg/m³ means micrograms per cubic meter: the estimated mass of fine particles in a volume of air.
A display of 10 µg/m³ means an estimated 10 micrograms of PM2.5 per cubic meter at the monitor’s location. It doesn’t identify the particles, explain their source, or measure every pollutant.
Check the app or manual for the averaging period. A current reading, an hourly average, and a daily average answer different questions.
Why AQI is a different number
AQI translates pollutant concentrations into categories for communicating outdoor air quality. An AQI of 50 and a PM2.5 concentration of 50 µg/m³ are different measurements.
AirNow’s AQI basics explains the categories. Above 100, outdoor air is unhealthy, initially for sensitive groups and then more broadly as values rise.
Outdoor community-sensor data, such as PurpleAir readings, can provide local context, but it isn’t an indoor reading and may use a different AQI calculation. Some monitor apps use regional AQI formulas or their own color bands. Check the selected system before comparing colors across devices.
Use EPA benchmarks with the right context
There isn’t a universal indoor PM2.5 number that guarantees zero health risk. Lower sustained particle concentrations are a sensible goal, but outdoor regulatory standards need careful interpretation.
The Environmental Protection Agency (EPA) sets National Ambient Air Quality Standards (NAAQS). EPA’s PM standards provide these U.S. primary, health-based benchmarks.
The NAAQS include these annual and 24-hour primary benchmarks:
| Benchmark | PM2.5 concentration | Averaging period |
|---|---|---|
| Primary annual standard | 9.0 µg/m³ | Annual means averaged over three years |
| Primary 24-hour standard | 35 µg/m³ | 98th percentile of daily averages, averaged over three years |
The annual and 24-hour averaging periods reflect different windows relevant to long-term and short-term exposure, respectively. Neither benchmark is an individual health-risk cutoff.
These NAAQS regulatory standards apply to outdoor ambient air, not a household monitor’s pass/fail result. The EPA strengthened the annual standard in 2024 while retaining the 24-hour standard.
A momentary reading above 35 µg/m³ doesn’t establish a regulatory exceedance. A reading below it doesn’t establish that your indoor air is risk-free.
“The 35 µg/m³ benchmark is a daily outdoor-air standard with a multi-year statistical form. It isn’t a threshold for deciding whether one minute indoors is safe.”
For home decisions, consider how high the reading is, how long it lasts, and whether you can reduce the source. A persistent increase deserves attention even when the display hasn’t crossed a manufacturer’s red zone.
Read the pattern, not every flicker
A single reading gives you a snapshot. The history graph helps you understand what happened and whether your response worked.
Learn your household baseline
Keep the monitor in one consistent location during ordinary use. Notice the readings when there’s no cooking, smoking, candle burning, or other obvious particle source.
Also check overnight and during periods when outdoor air quality is better. Those patterns establish a reference for your home, although a familiar baseline isn’t automatically a healthy one.
Use the same device and comparable time periods when assessing changes. Comparing one monitor’s current reading with another’s daily average can create confusion.
Separate a brief spike from sustained pollution
Look at how quickly readings rise, how long they remain elevated, and whether they return toward baseline.
Cooking-related increases often have a clear beginning. A longer-lasting rise can occur during a wildfire smoke event, though the monitor alone can’t confirm its source or your personal exposure.
Mark relevant events in the app if that feature exists. Otherwise, a short note about cooking, an open window, or purifier settings is enough.
Don’t chase tiny changes between adjacent readings. A clear rise or fall over time is more useful than a single-digit difference.
Understand why particle readings rise indoors
Common indoor sources include frying, searing, smoking, candles, incense, and wood-burning appliances. These human-made sources can release particles, and cooking can do so even when you don’t see smoke.
Outdoor particles can also enter through windows, doors, ventilation systems, and building leaks. Traffic emissions and industrial pollution contribute to air pollution, while wildfire smoke and natural sources such as windblown dust can affect indoor air, especially in urban environments.
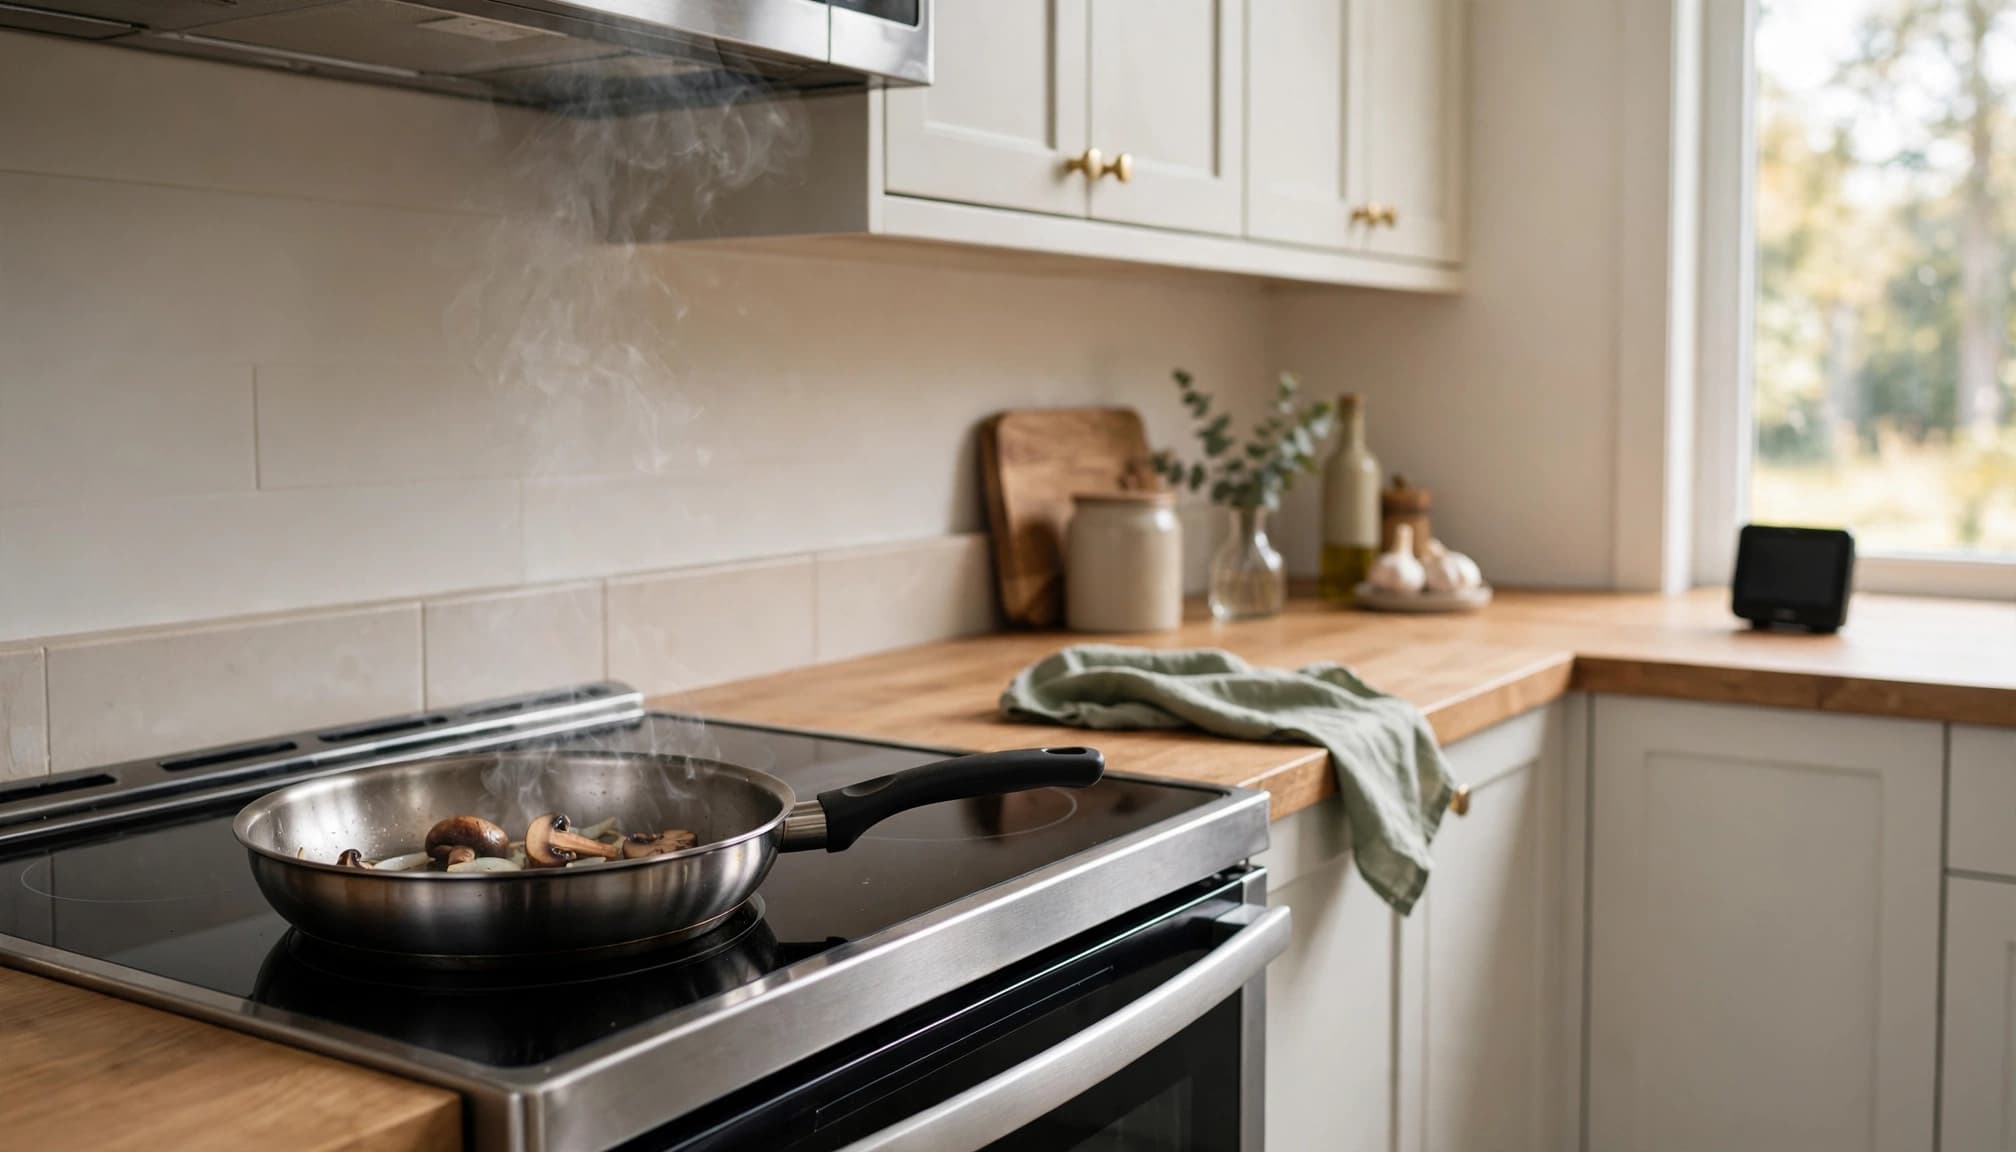
Before changing anything, consider what happened shortly before the increase. Was the stove running? Did someone open a window? Is there a local smoke advisory?
Moisture can complicate interpretation too. High humidity and droplets near showers or humidifiers can affect optical sensor readings. A sudden increase beside a humidifier doesn’t necessarily mean combustion pollution entered the room.
Move the monitor away from direct mist before drawing conclusions. You still want to address any genuine particle source, but the reading needs context.
Give your monitor a representative view
Place consumer air quality monitors where you spend time, with the air inlet unobstructed. Follow the manufacturer’s instructions and keep the device away from direct cooking plumes, humidifier mist, strong drafts, and purifier exhaust.
For routine room monitoring, a stable shelf or side table is usually more useful than moving the device repeatedly. A monitor directly beside an open window will emphasize incoming air rather than conditions across the room.
Keep doors and equipment settings consistent when comparing before-and-after readings. Otherwise, several changes happen at once and it’s harder to identify what helped.
EPA guidance on low-cost monitors explains their practical limits. Results vary with particle type, humidity, calibration assumptions, and device design.
Two monitors can disagree without either being completely faulty. Consumer sensors are useful for spotting patterns, but their measurements aren’t equivalent to reference-grade instruments.
If a reading seems implausible, check placement, maintenance instructions, warm-up requirements, and app settings first. Don’t assume a precise-looking decimal means equally precise measurement.
What to do when indoor PM2.5 rises
Start with manageable changes. Your monitor can help you see whether they reduce particles in the room.
Reduce the source and ventilate thoughtfully
Stop unnecessary particle-producing activities, such as burning candles or incense. While cooking, use a range hood that exhausts outdoors when available.
Check outdoor conditions before opening windows. Ventilation can help when outdoor air is cleaner, but it can bring more particles indoors during wildfire smoke or heavy pollution.
During smoke events, keep windows and doors closed when practical. Follow local guidance, and don’t let the room become dangerously hot.
If your indoor reading stays elevated despite reasonable changes, consider spending time in a cleaner indoor location recommended by local authorities.
Use filtration that fits the room
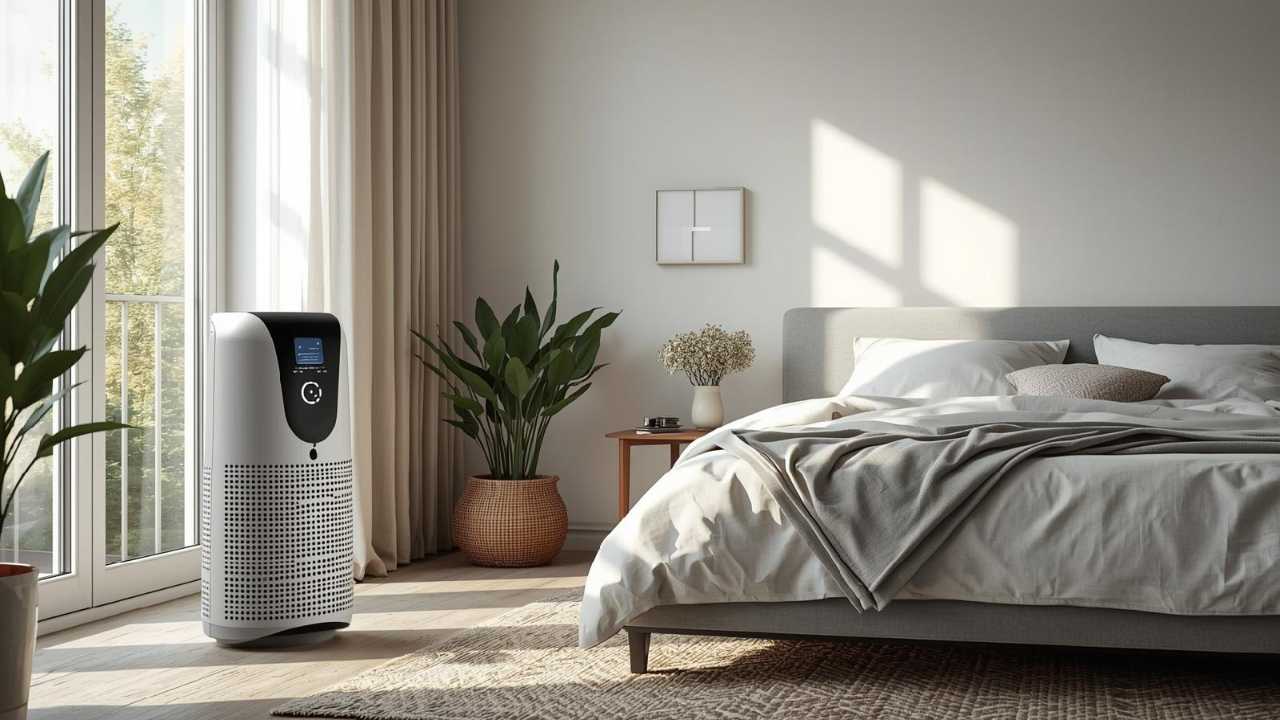
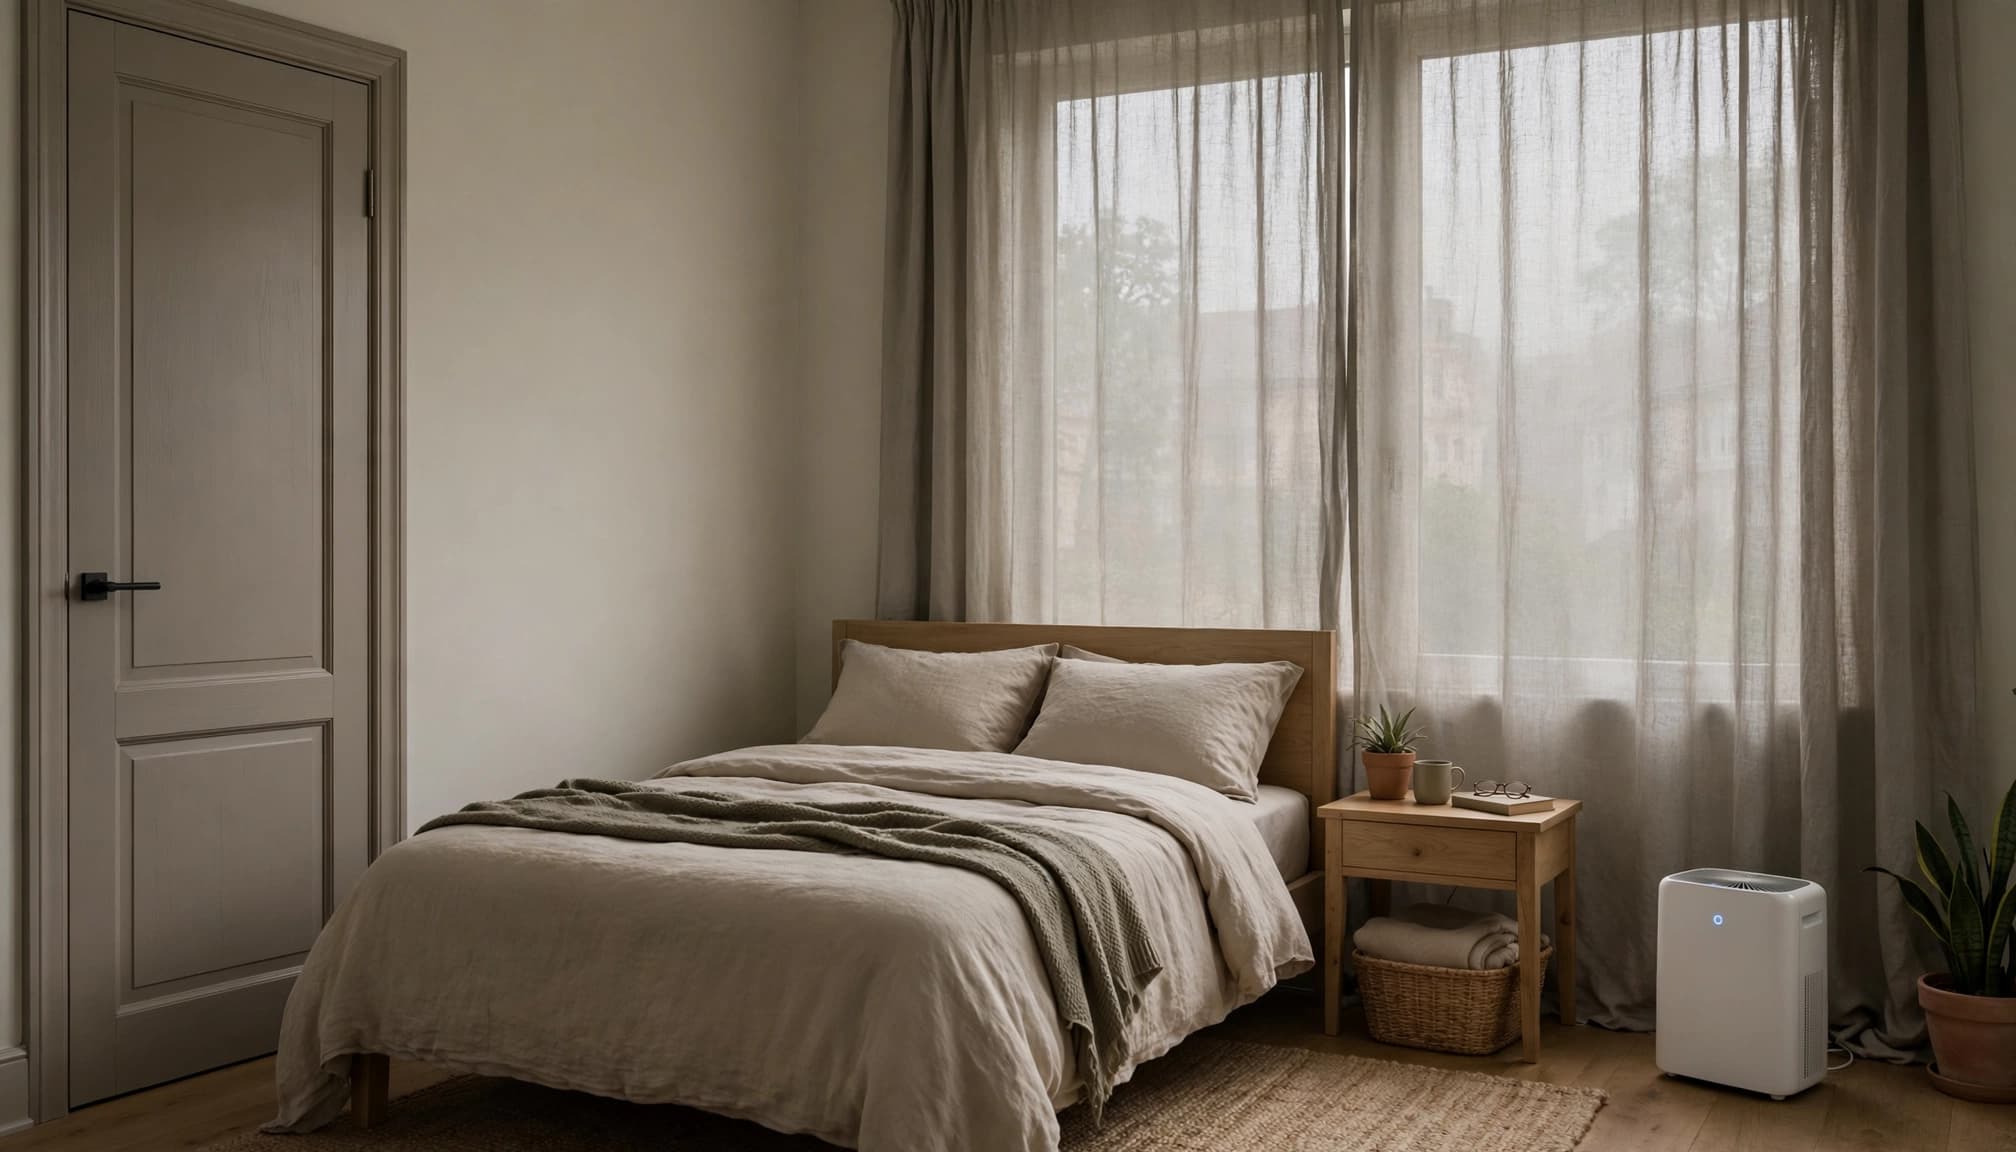
A portable air cleaner with HEPA filters or comparable high-efficiency particle filtration can reduce airborne particles. Room size and airflow matter alongside filter claims.
Look for clean air delivery rate (CADR), particularly the smoke rating. Choose a unit sized for the space and a fan setting you can comfortably keep running.
Breathful Living’s guide to air purifiers for wildfire smoke compares filtration options and practical trade-offs.
For a focused smoke response, EPA’s clean-room guidance describes using a closed room and appropriately sized filtration.
Watch for a sustained downward trend after making changes. Filtration supports cleaner air, but it doesn’t remove every pollutant or replace source control.
If you’re choosing filtration for a larger space, our high-CADR air purifier guide for large rooms explains how room size and airflow affect purifier performance.
Keep monitor readings separate from medical care
A PM2.5 monitor measures an environmental condition, not your individual dose from exposure to PM2.5. It can’t measure lung function or diagnose symptoms. It also can’t determine whether particles reached your bloodstream, affected your respiratory system, or caused health impacts.
People recovering from lung surgery may also want to read our guide to indoor air support after a lobectomy. If you have asthma or another diagnosed condition, keep following your prescribed treatment and action plan. Cleaner indoor air is supportive, not a replacement for medical care.
A low particle reading also doesn’t rule out carbon monoxide, gases, or other pollutants. Keep working carbon monoxide alarms where required, regardless of what your air quality monitor displays.
Pets share the indoor environment, so reducing smoke and unnecessary particle sources is reasonable for the household. A human AQI category isn’t a pet health threshold. Ask your veterinarian about concerns or changes in your pet’s breathing.
Seek urgent help for severe breathing difficulty or chest pain rather than waiting for the monitor to change.
Common questions about indoor PM2.5 readings
Does a reading of zero mean the air is perfectly clean?
No. Zero can mean the concentration is below the device’s reporting limit or rounded down.
It also says nothing about pollutants the monitor doesn’t measure. A reassuring particle reading is useful information, but it isn’t a complete indoor-air assessment.
Keep ordinary ventilation, source control, and alarm maintenance in place.
Can I rely on my purifier’s built-in sensor?
A built-in sensor can help automate fan speed, but it measures conditions near the purifier. Its location and the manufacturer’s settings influence the response.
A separate monitor can help you check another occupied part of the room. You don’t need one beside every appliance.
If automatic mode stays quiet while particles remain elevated elsewhere, try a higher manual setting and compare the trend.
Make the next reading useful
Start with the units, compare the reading with your home’s usual pattern, and look for a source you can change. Then check whether ventilation or filtration produces a sustained improvement.
Your monitor doesn’t need to become another source of worry. Used consistently, it can help you make calmer, better-informed decisions about the air where you live.